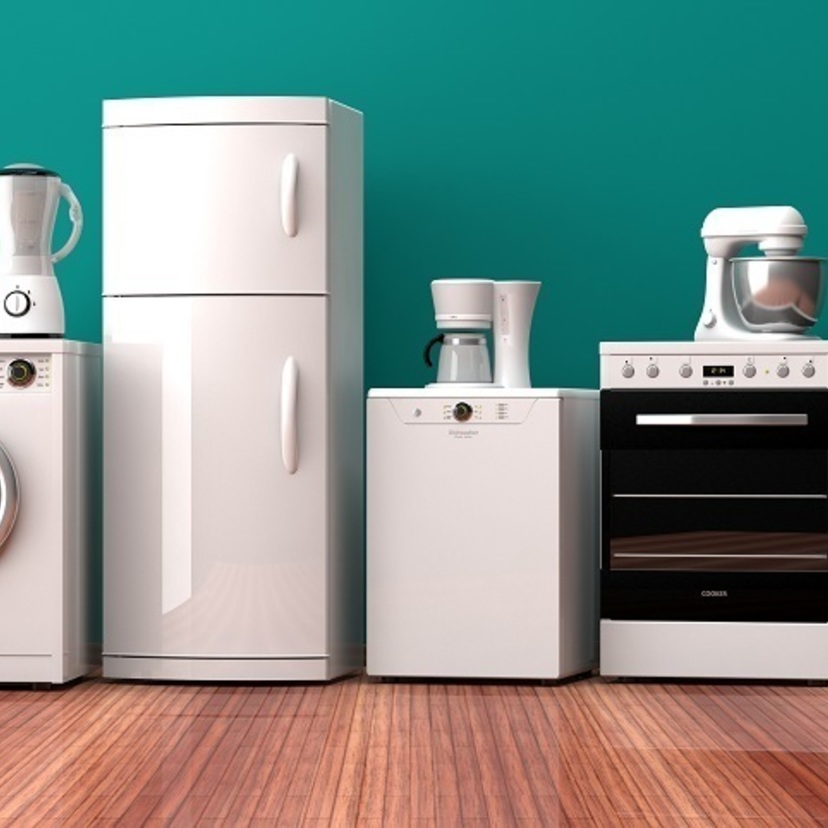
In this research, we focus on how home appliance companies in Japan are attracting customers online. We use our market analysis tool “Dockpit”, to find out how each home appliance company's website is attracting customers and how its traffic source.
Here, we used Dockpit's industry analysis to determine the top 30 home appliance websites by our own standard, excluding PC, smartphone manufacturers and their peripherals. The top 30 websites in terms of number of users were defined as "home appliance manufacturer websites".
Session ranking of home appliance manufacturers' websites
Firstly, we have summarized a ranking of the number of website sessions for home appliance manufacturers using Dockpit. Please see the table below.

Ranking of website session numbers for "home appliance companies" using Dockpit
Excludes manufacturers of digital devices such as PC, smartphones and their peripherals
Period: February 2020 - January 2021
Devices: PC and Smartphone
The websites of well-known Japanese home appliance manufacturers such as Panasonic, Sharp, Mitsubishi Electric, Hitachi and Omron are ranked in the top 10. Notably, British manufacturer Dyson is in the 8th place, suggesting the popularity of its cyclone vacuum cleaners in Japan.
From the 10th place onwards, other Japanese manufacturers such as Brother (famous for printers and sewing machines), Toshiba (a major electronics manufacturer) and Daikin (with a large market share of its air conditioner) are also ranked in. After Top 20 are also well-known Japanese manufacturers, which shows the popularity of domestic home appliance brands in Japan.
Summary of home appliance manufacturers' websites visitor's number
What’s the market size for home appliance industries in general? Let's take a look at the number of users, sessions and PVs across the top 30 brand’s websites using Dockpit.
"Total number of users, sessions and page views for "Home Appliance Companies" on Dockpit
*Excludes manufacturers of digital devices such as PC, smartphone and their peripherals
Period: February 2020 - January 2021
Devices: PC and Smartphone
The graphs above show the number of users, sessions and PVs on the websites of the major home appliance manufacturers over a year. The approximate figures in total are 84 million UUs, 1.4 billion sessions and 7.6 billion page views.
All three metrics increased dramatically in April 2020, when a state of emergency was declared by Japanese government following the first wave of Covid-19. Due to the fact that people were refrained from going out of the house and moved to remote working, potential customers who were considering purchasing have to gather information and shopping online instead.
The graph also shows a slight increase of numbers in December. This is thought to be the increase in sales of seasonal appliances such as heaters following the cold snap at the end of 2020.
Session share of home appliance manufacturers’ website visit
Now let's compare the share of visitors of each website. The pie chart below shows each website's share of the total number of sessions for all home appliance manufacturers over the past year.
Industry share of “home appliance companies” using Dockpit
*Excluding manufacturers of digital devices such as PC, smartphone and their peripherals
Period: February 2020 - January 2021
Devices: PC and Smartphone
The pie chart above shows that the home appliance company with the largest session share of customer traffic is "Panasonic". Their member site(for people who use their products) Club Panasonic accounts for 24.6% while their brand website accounts for 13.2% of the session share, which in total accounts for nearly 40% of the entire industry.
The 2nd largest share of customer traffic is Sharp. Sharp's brand website accounts for 20.8%, and the website of SHARP COCORO LIFE (which was established as a subsidiary company in 2019 as an IoT home appliance brand) accounts for 6.7% of the session share, giving a combined share of nearly 30% of the entire industry.
In other words, Panasonic and Sharp have a combined share of nearly 70% of the domestic white goods manufacturers' websites. In addition to Panasonic and Sharp, Canon has a 5% share of the market, mainly beacause it is the strongest manufacturer in the digital camera market.
What is the traffic source of home appliance manufacturers’ website visit?
How do visitors arrive at each of the home appliance manufacturer’s website? Finally, let's take a look at the traffic source. We have broken down the number of sessions for each type of traffic source – organic search, paid search, referral site and display ad - across all home appliance websites. See the pie chart below.
The traffic source of home appliance companies identified by Dockpit
Excludes manufacturers of digital devices such as PC, smartphone and their peripherals.
Excluding "no referrer" data.
Period: February 2020 - January 2021
Devices: PC and smartphone
Comparing each traffic source, the largest portion was "organic search" which accounts for 43.4%. This is followed by referral site (32%) and email (14.1%).
The second largest share of "referral site" is mainly because many users visit manufacturers' websites via major retailers' websites or e-commerce websites. For example, the referral site for Panasonic’s official website, which attracted the largest share of visitors in the previous section, is listed as follows.
Referral site for Panasonic's official website using Dockpit
Period: February 2020 - January 2021
Device: PC and Smartphone
The data above shows that excluding the Panasonic affiliate ad sites, major comparison sites like kakaku.com, e-commerce sites such as Bic Camera, Joshin, and Yahoo! Auction accounts for relatively high share.
Today, many people already use online shopping sites to buy home appliances, and it is likely that an increase for using brands’ official sites for comparison can be inferred.
In addition, the proportion of "paid search" and "display ads" is small (lower than 10%). This suggests that manufacturers are not directly promoting their products via online advertising, but instead are attracting customers via other e-commerce sites.
Summary
In this research, we have summarized the customer attraction structure for home appliance manufacturers in Japan, from the perspective of session share and traffic source.
While the results show that Panasonic and Sharp are the two top players in the current home appliance industry, there are few cases where manufacturers directly attract customers through online advertising can also be observed.
The e-commerce market in Japan will continue to grow, and it is possible that some companies will break the current digital hierarchy. We hope that this research can be useful for your market research in Japan.
Outline of our research
Analysis based on online behavior logs and user demographic information under the permission of our panelists in Japan.
The analysis is based on the online behavior log data from February 2020 to January 2021.
The data use weighted figures based on the occurrence of our panelists, in accordance with Japanese Internet user’s composition ratio.
Devices: Both PC and smartphone data are being used within the research.
*The data in this article was collected using Dockpit, an online behavior log research tool. If you want to know the detail, please register for Dockpit free.

※日本語での記事はこちらをご確認ください↓
家電メーカーTop30のサイトユーザー数や集客構造を調査【業界別で見るデジタル集客の勢力図】
https://manamina.valuesccg.com/articles/1279ヴァリューズが提供するマーケターのためのリサーチエンジン「Dockpit」では、業界ごとのWebサイトユーザー数やユーザー属性、集客構造等を一元的に把握できる「業界分析」が行えます。本連載「業界別で見るデジタル集客の勢力図」ではそのデータの一部を掲載し、マナミナ編集部のライターが読み解きます。今回取り上げるのは家電メーカー。業界の市場調査や提案資料を作成される際など、実務にぜひご活用ください。


マナミナは" まなべるみんなのデータマーケティング・マガジン "。
市場の動向や消費者の気持ちをデータを調査して伝えます。
編集部は、メディア出身者やデータ分析プロジェクト経験者、マーケティングコンサルタント、広告代理店出身者まで、様々なバックグラウンドのメンバーが集まりました。イメージは「仲の良いパートナー会社の人」。難しいことも簡単に、「みんながまなべる」メディアをめざして、日々情報を発信しています。